Do you know that your page is performing bad under heavy load? Do you know what methods and SQL querys that are responsible for the excessive system usage?
If not, then you should use HP/Mercurys tool called Diagnostics Profiler.
It was designed to be used together with Diagnostics Server, but they also released a free to use version mode - called the Profiler mode.
In the .NET environment you install a probe on the web server you want monitored and scan your business logic binaries to set up a .points file. This points file is telling the profiler which methods on top of the ordinary ASP.NET stuff it should look for. You can also set up specific .points files for ADO.NET and such.
The profiler is listening on a port span you set up, and it defaults to port 35000. To access the profiler you just go to the site in your browser: http://localhost:35000/profiler and this view shows up:
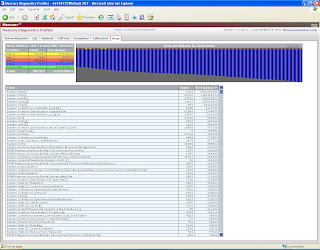
The profiler can also give you an overview on how the heap is growing over time, how many objects that survives garbage collection and what classes that are most common, and use the most amount of space in your heap.
It is also possible to see the long-running SQL querys or Stored Procedures of your application and to see a call breakdown of the page that is calling these procedures, methods or querys.


Inga kommentarer:
Skicka en kommentar